
How to Calculate Cost Per Mile

Flex Electric
The UK's #1 Electric Moped and Electric Motorbike dealer.

You finish a long delivery shift, check the app and see £85 in earnings, then remember the rear tyre you replaced, the insurance payment due, and the finance instalment leaving your account. The electricity used to charge your electric moped may have cost very little, but that doesn't mean the shift was cheap to run.
That distinction matters for anyone commuting or working on a UK electric moped or motorbike. Cost per mile should include the expenses that keep the vehicle available, not just the energy that moves it. The calculation below shows how to find that number, compare it with HMRC mileage rates, and identify the costs reducing your real margin.
Why Cost Per Mile Matters for Electric Riders
A delivery rider can finish a shift believing the vehicle cost almost nothing because charging added only a small amount to the electricity bill. The figure may look different once depreciation, insurance, finance, servicing and tyres are allocated across the miles ridden. UK estimates for home-charged electric energy commonly fall around 2–7p per mile, while petrol fuel alone is often around 13–18p per mile, depending on vehicle efficiency and fuel type, as outlined by UK car-cost guidance. Energy is only one part of the comparison.
Your electric moped loses value as it ages and accumulates mileage. You may also pay for licensing, protective equipment and charging equipment, alongside routine servicing, repairs and insurance. Delivery cover can cost more than ordinary commuting cover, and a policy that excludes business use is not a usable saving. Finance charges also remain part of ownership, even when the vehicle is parked.

The margin is decided by the whole vehicle
Suppose annual vehicle costs total £6,000 and you ride 10,000 miles. The cost per mile is 60p, calculated by dividing £6,000 by 10,000 miles. The electricity bill may be modest, yet fixed ownership costs can still create a high all-in figure when annual mileage is low.
Mileage changes the result. A delivery rider covering many miles spreads insurance, depreciation and finance across more journeys. A commuter riding fewer miles carries the same fixed costs over a smaller distance, so each trip absorbs more of them.
Practical rule: If your calculation includes only electricity, you have measured energy cost per mile, not true cost per mile.
This figure supports better decisions. A delivery rider can compare vehicle cost with platform earnings and mileage compensation. A commuter can compare electric ownership with petrol or public transport. A small operator can judge whether a vehicle is earning its place in the fleet.
For operational context, riders and fleet owners can also use striveX Ltd logistics expertise when reviewing routes, vehicle use and wider transport costs. Record each relevant cost, annualise it consistently, then divide the total by miles covered.
Breaking Down Every Cost Component
Begin with categories, not a calculator. Fixed costs continue while the vehicle is parked. Variable costs usually increase with mileage, charging, traffic and wear. Keeping these groups separate shows why a low electricity bill can still sit alongside a high all-in cost per mile.
Energy and ownership costs
Measure energy from actual charging records. Take the electricity cost, divide it by the kilowatt-hours used, then compare that result with the miles covered. Home energy may be only 4–6p per mile, with some off-peak estimates around 2–5p, according to UK running-cost guidance. That figure is useful, but it does not include the cost of owning the vehicle.
Depreciation is often the largest hidden item. Subtract the expected resale value from the purchase cost, then spread the difference across the miles you expect to ride. A commuter with limited annual mileage may face a high depreciation cost per mile, while a delivery rider can spread the same loss across many more journeys.
Finance belongs in a separate line. Include interest and agreement charges from the finance documents, not only the monthly payment. The payment may combine repayment and interest, and the vehicle still loses value during the agreement.
Insurance must reflect the work being done. Use the annual premium on the policy documents, and check whether the policy covers ordinary commuting, business travel or delivery work. A cheap personal policy may not be a usable cost for a rider carrying paid orders.
Wear, compliance and charging equipment
Maintenance includes servicing, brake components, fluids, inspections and unplanned repairs. Track tyres separately when frequent replacements make them a noticeable cost. Keep invoices and divide the spend by the miles since the work was completed, or estimate an annual figure from your own maintenance history.
Licensing and tax may include registration-related costs, licence or CBT expenses where applicable, and other compliance charges. Check the tax treatment for your circumstances rather than assuming every payment is recoverable.
Charging equipment also has a cost. Spread a home wallbox installation across its expected ownership period or the charging miles it will support. For a delivery rider, include this even when workplace or public charging is also used.
Cost ComponentTypical UK RangeHow to Find Your FigureHome energyAbout 2–7p per mile for energy aloneElectricity bill and charging recordsPetrol fuel comparisonAbout 13–18p per mileFuel receipts and mileage recordsInsuranceUse your actual annual premiumInsurance certificate and renewal noticeDepreciationVehicle-specificPurchase records and realistic resale estimateFinanceAgreement-specificFinance statement showing interest and chargesServicing and repairsVehicle and usage-specificWorkshop invoices and bank statementsTyresVehicle and mileage-specificTyre invoices and odometer readingsCharging equipmentInstallation-specificInstaller invoice, spread across ownership
The wider UK true-cost picture for cars can reach roughly 30–50p per mile, while some fleet guidance places all-in ownership around 45–55p per mile, with depreciation often the largest element, as explained by Fuelwise's true-running-cost analysis. These are not direct moped figures. They show why cheap electricity alone cannot define the cost of each mile.
The Cost Per Mile Formula and Worked Examples
The basic formula is:
Total annual costs ÷ total annual miles = cost per mile
Keep the time period consistent. Annualise monthly or quarterly payments, then divide the complete total by annual miles. Fixed costs include insurance, finance and depreciation. Variable costs include energy, tyres, servicing and repairs.
The worked examples below use illustrative arithmetic to show the method. They aren't market averages, and you should replace every assumption with your own records.
Solo commuter example
A commuter rides 8 miles each way, works 230 days per year, and therefore covers 3,680 commuting miles annually. If the vehicle uses 50 Wh per mile, annual energy consumption is 184 kWh. At an illustrative home electricity rate of 30p per kWh, energy costs £55.20, or 1.5p per mile.
Assume annual fixed costs of £1,200 for depreciation, £600 for insurance and £1,000 for finance. Add £300 for servicing and repairs and £250 for tyres. Total annual cost is £3,405, producing 92.5p per mile across commuting miles. This looks high because the fixed costs are spread over a relatively limited mileage base.
Delivery fleet example
A fleet of three mopeds covers 150 miles per day each. If the fleet operates 250 days annually, total mileage is 112,500 miles. At the same illustrative efficiency of 50 Wh per mile, energy use is 5,625 kWh. A mixed charging cost of 35p per kWh produces £1,968.75 in annual energy cost, or 1.8p per mile.
Suppose the fleet's combined annual depreciation is £9,000, insurance is £6,000, finance is £6,000, servicing and repairs are £7,500, and tyres are £3,000. Total cost is £33,468.75, giving 29.7p per mile. The larger mileage base spreads fixed costs more effectively.
Cost ComponentSolo Commuter (p/mile)Delivery Fleet (p/mile)Energy1.51.8Depreciation32.68.0Insurance16.35.3Finance27.25.3Servicing and repairs8.26.7Tyres6.82.7Total92.529.7
A vehicle such as the Vmoto VS2 Citi is described as a 125cc equivalent electric scooter with a 50mph top speed and 66 mile range, designed for urban mobility and commercial use. Those specifications can help you model suitability, but they don't replace your own energy, ownership and maintenance records.
For business users, keep mileage logs separate from personal travel. Guidance on business mileage HMRC rules can help organise the records you need before comparing reimbursement with actual cost.
Actual Costs Versus HMRC Mileage Rates
A rider can pay only a few pence for electricity yet still face a much higher all-in cost once depreciation, insurance, finance, servicing and tyres are included. Your calculated cost per mile answers, “What does this vehicle cost?” HMRC mileage rates answer a different question: which approved rate may apply to qualifying business travel.
For the 2026 to 2027 tax year, HMRC's advisory mileage guidance lists 24p per mile for motorcycles. Cars and vans attract 55p per mile for the first 10,000 business miles and 25p thereafter, while bicycles are listed at 20p per mile. A moped or motorcycle user should compare against the motorcycle rate rather than borrowing the car figure.
Consider a rider covering 15,000 business miles with actual costs of 18p per mile. The actual cost is £2,700. Applying the official 24p motorcycle rate produces £3,600, a difference of £900, calculated directly from the HMRC rate and the stated mileage. That gap is not automatically profit. Its tax and reimbursement treatment depends on whether the rider is employed, self-employed, reimbursed by a business, and using an approved method correctly.
Rider TypeAnnual MilesActual Cost/MileHMRC RateAnnual DifferenceBest MethodDelivery rider15,00018p24p£900Compare both, then confirm tax treatmentCommuter with business travelRecord actual milesUse records24p for motorcycle travelVehicle-specificUse the method your employer or tax position permitsFleet operatorFleet totalFleet calculation24p for motorcyclesFleet-specificCompare reimbursement with actual fleet cost
The flat rate is convenient because it combines running costs into one mileage allowance. Actual-cost accounting gives a clearer view when insurance, depreciation or repairs are unusually high, but it demands better records and consistent treatment.
Do not switch methods casually halfway through a tax year. Keep an odometer log showing the date, purpose, destination and business mileage for each qualifying journey. Retain invoices, policy documents and charging records when calculating actual costs, then confirm the correct approach with HMRC or a qualified adviser.
Practical Ways to Reduce Your Cost Per Mile
The best saving usually comes from the largest cost in your own calculation, not from chasing tiny energy differences. If depreciation dominates, riding more efficiently won't solve the main problem. If charging dominates, tariff and charging location deserve attention first.
Improve energy and vehicle use
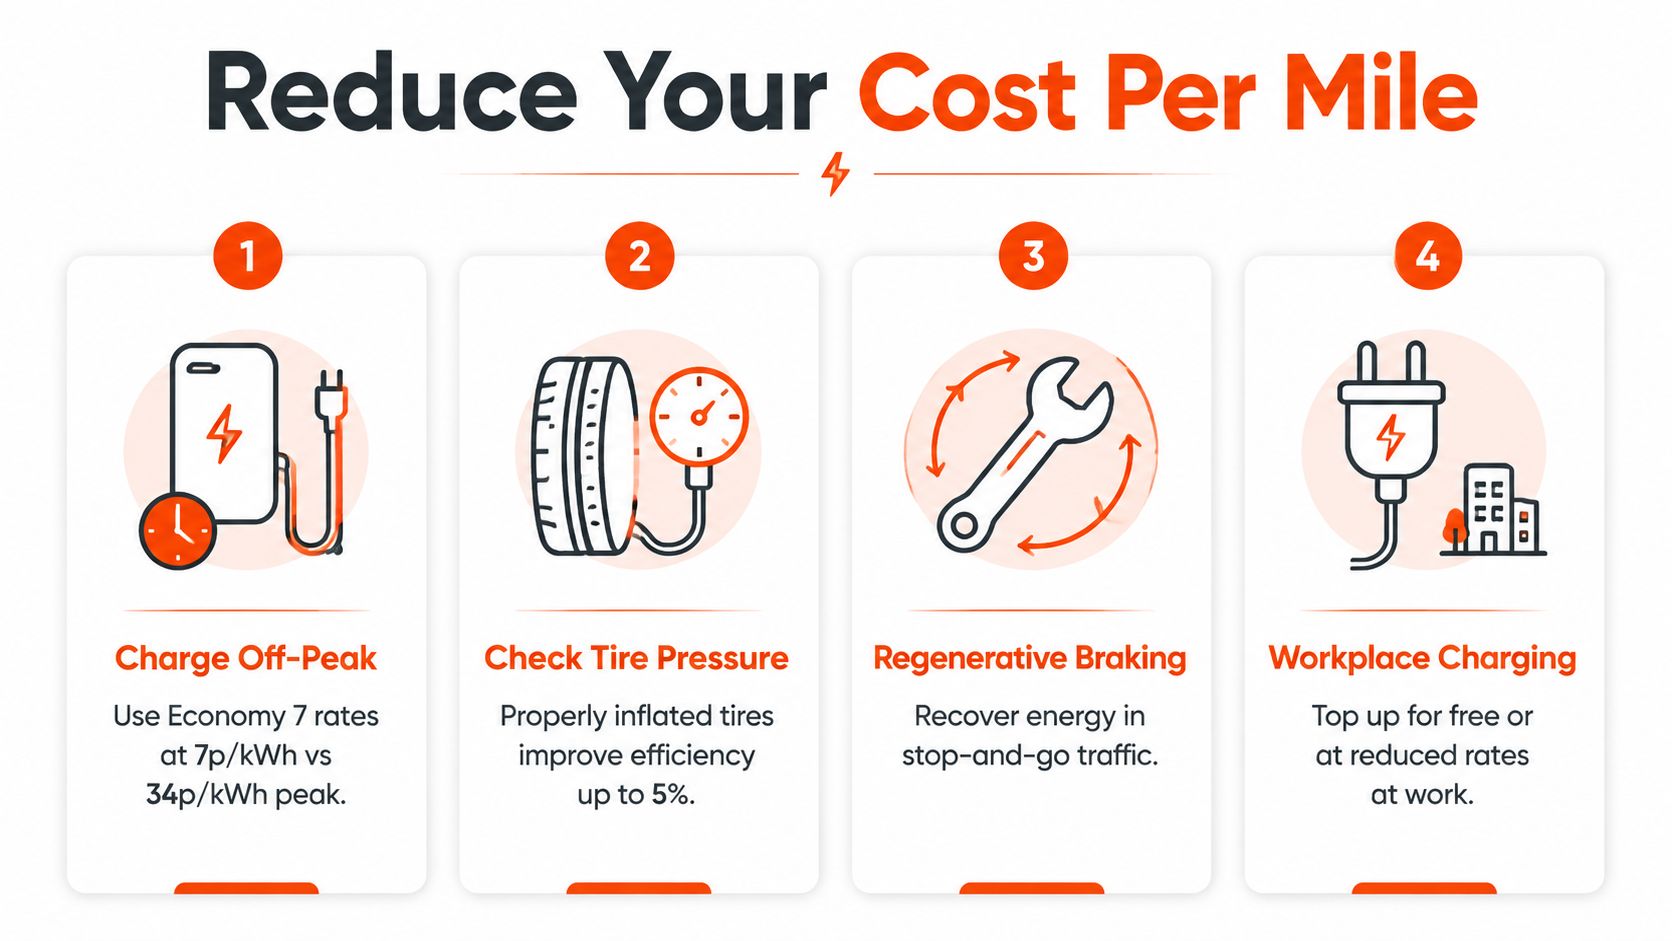
Off-peak charging can reduce the energy component where your tariff supports it. Workplace charging may also reduce home electricity use, but check the actual terms rather than assuming it's free. Smooth acceleration, sensible route choices and avoiding unnecessary detours help preserve usable range and reduce dead mileage.
Battery care matters because replacement timing affects depreciation. Follow the manufacturer's charging guidance, avoid leaving the battery in unsuitable conditions, and plan routes so you're not repeatedly forcing the vehicle through avoidable deep-discharge cycles.
Control wear and insurance
Preventive checks catch problems before they become breakdowns. Inspect tyres, brakes, lights and fasteners regularly, keep service records organised, and compare fixed-price workshop options. DIY work can reduce labour cost, but only tackle jobs you can complete safely and legally.
Insurance needs an annual review. Delivery riders should disclose business use accurately, while commuters may find that mileage, excess and policy features change the premium. Fleet operators should compare individual policies with fleet arrangements, but the cheapest quote isn't useful if it excludes the work you do.
Route planning also protects margin. Grouping nearby deliveries, reducing empty repositioning and matching jobs to available battery range can help boost field team revenue by improving how each paid mile is used.
Cost-cutting principle: Reduce the expense that appears highest in your own table, then recalculate. General advice is less valuable than your records.
Use the supplied video as a practical prompt for reviewing electric efficiency and riding habits:
Don't insert unsupported savings estimates into your budget. The right result depends on your tariff, mileage, vehicle, insurance and maintenance history.
Putting Your Numbers Into Action
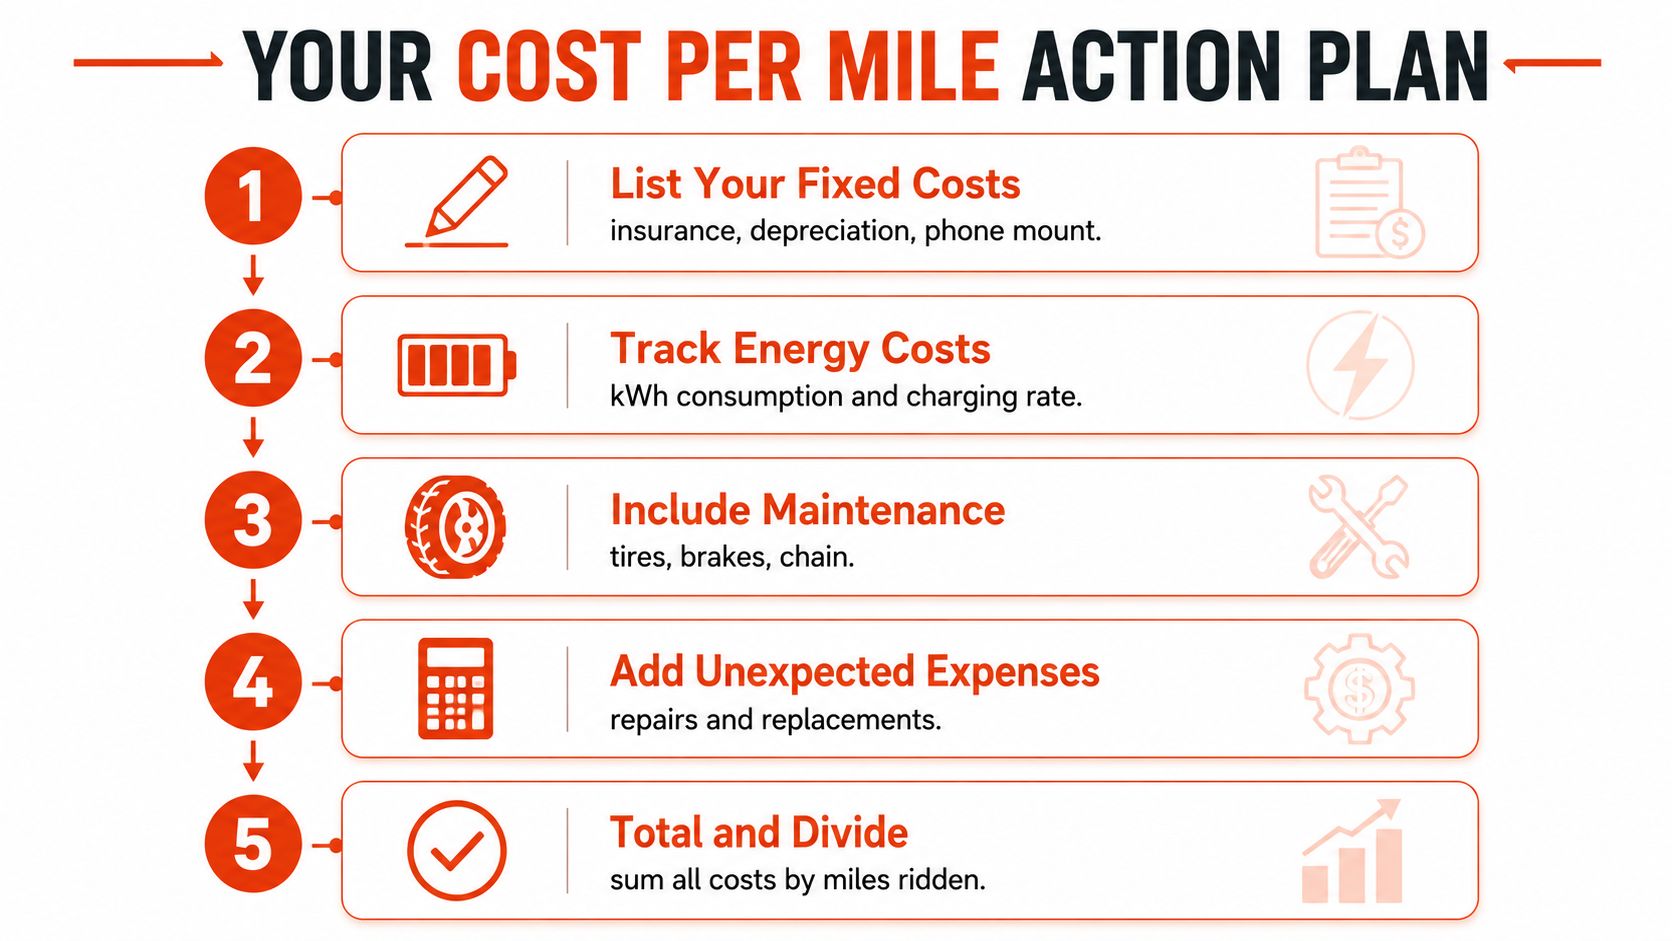
Turn the calculation into a monthly routine rather than a one-off estimate.
- List fixed costs. Record insurance, depreciation, finance, licensing and charging equipment.
- Track energy. Save charging receipts or meter readings, then convert kWh into cost.
- Log wear. Add tyres, servicing, repairs and other work-related vehicle expenses.
- Record every mile. Separate business, commuting and personal journeys.
- Add and divide. Total the period's costs and divide by the corresponding miles.
A new delivery rider should compare the resulting figure with expected mileage compensation and earnings, not just the advertised hourly opportunity. A commuter should compare the full electric figure with the full cost of alternatives. A fleet manager should calculate each vehicle separately, then review the fleet total.
Recalculate after an insurance renewal, major service, repair, finance change or shift in mileage pattern. Monthly tracking reveals whether energy, depreciation or maintenance is moving the result, while a quarterly review gives you enough information to make replacement and route decisions with confidence.
Flex Electric supplies electric mopeds, scooters and motorbikes for commuting and delivery use, with model specifications, accessories, nationwide delivery and after-sales support available through its UK operation. Visit Flex Electric to compare suitable vehicles and build a cost-per-mile calculation around your actual riding pattern before you buy.
Find us
You will find us at 74 Dalry Road, Edinburgh, EH11 2AY
Showroom Opening Times:
Monday: By Appointment
Tuesday to Friday: 11am - 5:00pm
Saturday: 10am - 5pm
Sunday: By Appointment
