
How to Calculate Energy Efficiency for Electric Motorbikes
Flex Electric
The UK's #1 Electric Moped and Electric Motorbike dealer.
You've probably done this already. You've plugged in your electric moped or motorcycle after a week of commuting, looked at the electricity bill, and thought: I know this is cheaper than petrol, but what is it costing me to ride?
That's the practical version of how to calculate energy efficiency. Not lab testing. Not motor engineering theory. Just the numbers that tell you what your bike uses, what each trip costs, and whether your range and charging habits make sense in day-to-day UK riding.
For electric motorcycles, mopeds, off-road electric motorbikes, and kids motocross bikes, this matters more than most riders realise. A road commuter wants pounds per mile. A delivery rider wants repeatable daily cost. An off-road rider may care more about usable session time between charges. The maths starts from the same place, but the useful answer changes depending on what you're trying to measure.
Table of Contents
- Wh per kilometre and why riders like it
- kWh per 100 kilometres for easier comparison
- Percentage efficiency and where energy goes
- A practical method you can use at home
- If you only have your electricity bill
- The formulas that matter
- Why wall power and bike power are not the same
- What your number says about your riding
- A useful benchmark mindset
Why Your Electric Moped's True Running Cost Matters
A rider in Edinburgh charges an electric moped overnight, rides the same commute all week, and assumes the running cost is low. That assumption is usually right. It still does not give you a number you can budget with.
What matters is knowing what each mile or kilometre is costing you on your roads, in your weather, at your electricity rate. For UK riders, that usually means working from the figures you already have. Battery size, odometer readings, charger use, and your home tariff are often enough to build a useful picture without getting lost in engineering theory. This guide is aimed at electric motorcycles and mopeds, not e-bikes, because the battery sizes, speeds, and charging habits are different enough to need their own method.
At Flex Electric, this is the point I see riders miss most often. They look at claimed range and forget that running cost changes with stop-start traffic, hills, cargo, temperature, and how aggressively the bike leaves the lights. Two riders on the same model can end up with very different costs.
Practical rule: If you can work out your cost per mile and your energy use per distance, you can make better decisions about routes, charging, and bike choice.
That matters even more if the bike earns money. A delivery rider needs to know whether repeated short trips are pushing energy use up enough to affect margins. A commuter needs to know whether charging at home on an off-peak tariff is making a noticeable difference. A household comparing transport costs might also find broader tips for home energy efficiency useful, because the same electricity bill often covers both the bike and the rest of the property.
What riders usually get wrong
- Using brochure range as a cost estimate: Range claims help with headline comparisons, but they do not tell you what your own weekly charging spend looks like.
- Forgetting charging losses: Power drawn from the wall is higher than the energy stored in the battery, so wall cost matters more than battery capacity alone.
- Mixing up different definitions of efficiency: Motor efficiency, battery use per mile, and running cost each answer a different question.
Start with the numbers you can measure. Record what you charge, how far you ride, and what your electricity costs. That gives you a figure you can use in day-to-day decisions, not just a spec-sheet talking point.
Understanding the Key Efficiency Metrics
Before doing any maths, it helps to separate the three measurements riders tend to lump together under one word.
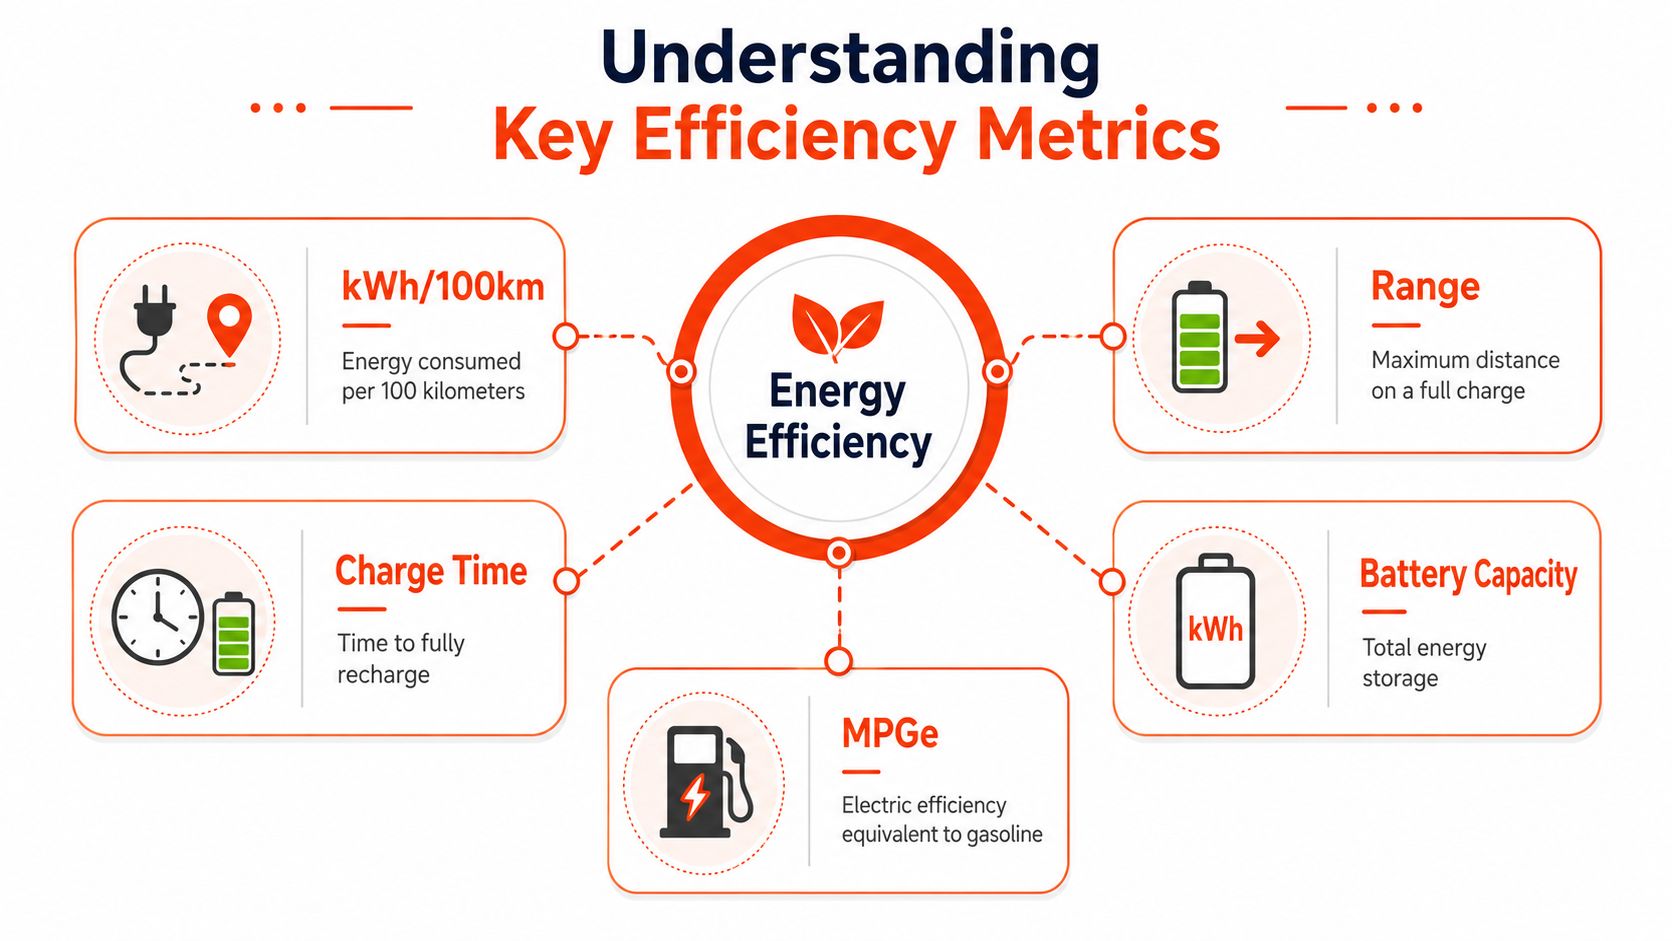
Wh per kilometre and why riders like it
Watt-hours per kilometre (Wh/km) is the cleanest day-to-day consumption figure for an electric motorbike. It tells you how much energy the bike uses to travel one kilometre.
Think of it as the electric equivalent of fuel consumption on a very small scale. Lower is better. If your Wh/km rises, the bike is using more energy to cover the same ground.
This is the metric I'd use first for:
- Commuters tracking the same route each week
- Delivery riders comparing busy shifts against quieter ones
- Off-road riders trying to understand how terrain changes battery use
Because it's granular, Wh/km is good at showing the effect of headwinds, heavy throttle use, cargo weight, poor tyre pressure, or cold weather.
kWh per 100 kilometres for easier comparison
kWh/100km is the same idea, just scaled up. Some riders find it easier to read because the number feels more familiar and easier to compare across different electric vehicles.
If Wh/km is your close-up view, kWh/100km is your wider lens. It's useful when:
- you're comparing two different bikes
- you're discussing fleet use
- you want a neater figure for operating-cost records
Both figures describe consumption. They just present it differently.
If you're already looking at household electricity use and trying to make better sense of your charging costs, broader tips for home energy efficiency can help you spot what's bike charging and what's general household demand.
Percentage efficiency and where energy goes
Percentage efficiency answers a different question. It's about how effectively energy moves through the system, from charger to battery to motor to wheel.
That matters, but riders often jump to this too early. For real ownership costs, consumption figures are usually more useful than a percentage on its own.
Wall-to-wheel cost efficiency is what most owners care about first. It reflects what you actually pay for, not just what the drivetrain does under ideal conditions.
Here's a simple way to look at it:
MetricWhat it tells youBest useWh/kmEnergy used per kilometreDaily trackingkWh/100kmEnergy used over a standard distanceComparing bikes or routesEfficiency %How much energy is lost in the systemUnderstanding losses
A lot of confusion comes from mixing these together. If you keep them separate, the calculations become straightforward.
The Real-World Method for Calculating Efficiency
A rider finishes a week of commuting, plugs in at home, then looks at the electricity bill and wonders what the bike costs to run. That is the calculation most UK moped and electric motorcycle owners need. Not drivetrain lab figures, and not generic EV formulas copied from car articles. A practical home test gives you numbers you can use.
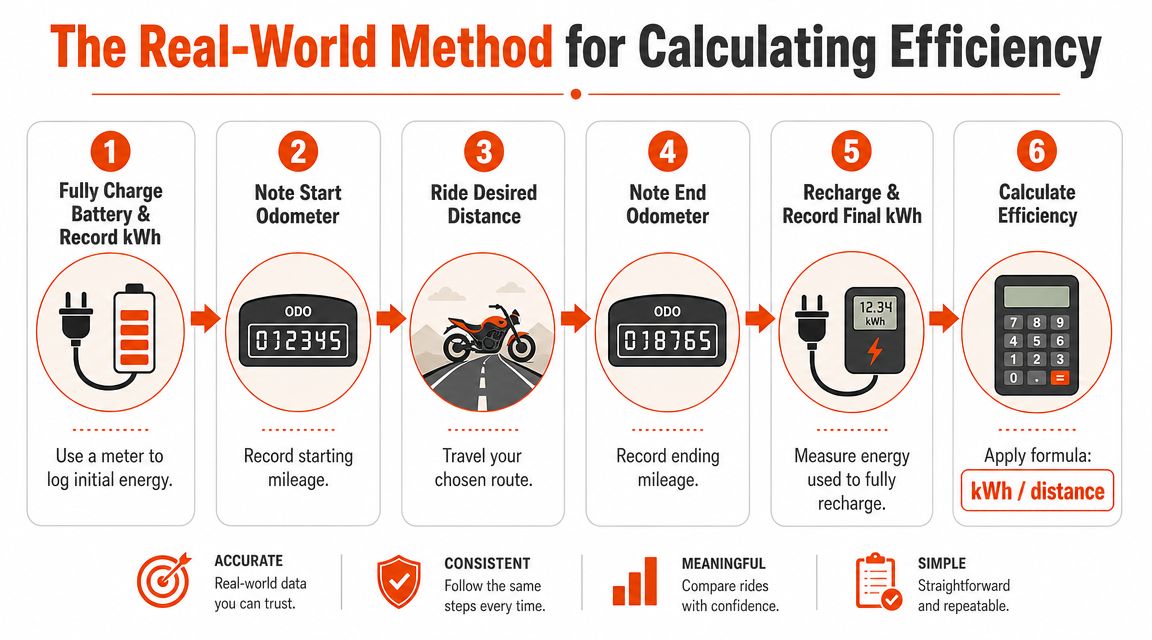
A practical method you can use at home
For running costs, measure energy at the wall. That means the electricity pulled from the socket during charging, because that is what appears on your bill. It also captures charging losses, which riders often miss when they rely only on battery capacity.
Use one repeatable process:
- Charge the battery to full
- Note the odometer
- Ride a route that matches normal use
- Note the odometer again
- Charge back to full from the same state of use
- Record the kWh used for that recharge
A plug-in energy meter is the simplest tool for this. If your charger setup does not allow that, keep the charging point, charging habit, and test route consistent so your comparisons stay useful. I would always take consistency over a supposedly precise one-off reading done under odd conditions.
If you only have your electricity bill
Plenty of riders do not have a dedicated charger meter at home. You can still estimate efficiency well enough to price your weekly riding and compare one month with another.
Start with the figures you already have:
- your electricity tariff
- your battery size
- your rough charging pattern
- your distance covered over the same period
Then work backwards. Estimate how many full or partial charges you did in a week or month, compare that with your mileage, and sense-check it against the change in household electricity use. It is not as neat as a socket meter, but it is good enough for ownership maths.
If you need help making sense of the supply readings first, Connect VPP's meter reading guide explains the meter side clearly.
This approach is especially useful for UK riders on domestic tariffs, where the question is usually simple: how much did those commutes, delivery runs, or town trips add to the bill? It is also built for electric motorcycles and mopeds, not electric bicycles, which have different battery sizes, charging patterns, and use cases.
The formulas that matter
You only need three calculations for a solid working picture.
1. Consumption in Wh/km
CalculationFormulaWh/km(kWh used × 1000) ÷ kilometres ridden
2. Consumption in kWh/100km
CalculationFormulakWh/100km(kWh used ÷ kilometres ridden) × 100
3. Cost by distance
CalculationFormulaTrip costkWh used × your electricity rateCost per mile or kilometretrip cost ÷ distance travelled
Use a route that reflects your ordinary riding. Urban stop-start traffic, cold weather, hills, a pillion, heavy kit in the top box, and hard acceleration all shift the result. At Flex Electric, this is the bit riders tend to underestimate. A tidy figure from an easy Sunday run is rarely the number that matches a wet Tuesday commute across town.
Run the same test a few times and average it. One ride can be skewed by temperature, wind, traffic, or charging conditions. Three normal rides usually tell you far more than one perfect one.
Worked Example A Vmoto TC Max
A worked example makes this much easier to follow. The point here isn't to claim a universal number for every Vmoto TC Max. It's to show the method clearly enough that you can copy it for your own bike and your own tariff.
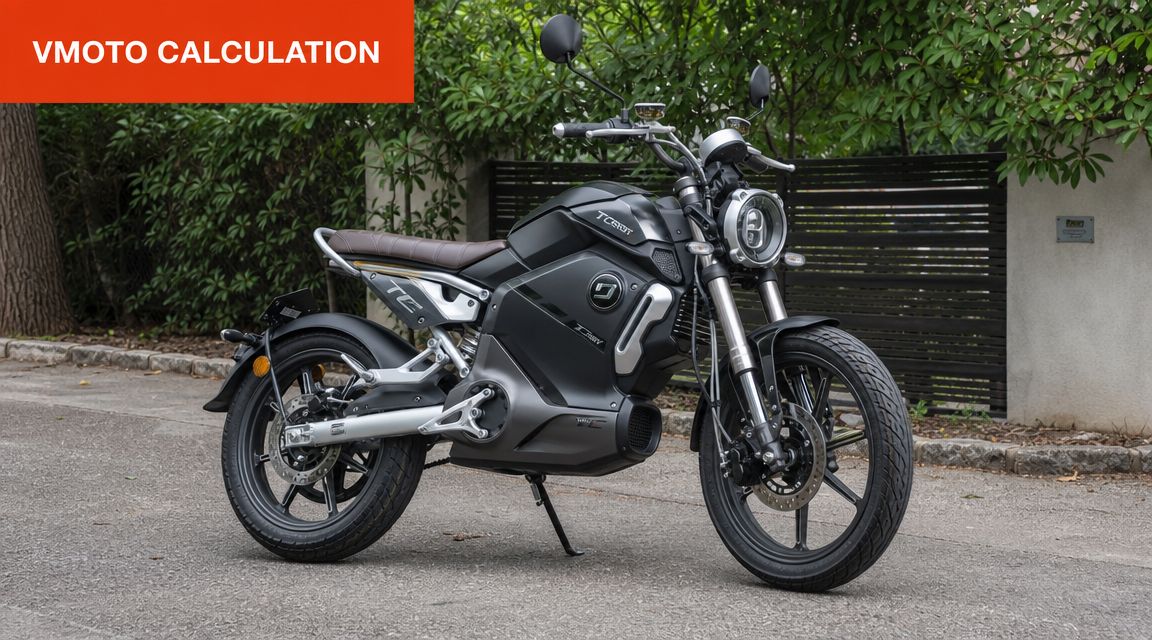
A sensible way to run the test
Take a Vmoto TC Max and ride a normal mixed route. Not a careful demonstration run. Not a flat-out range test. Just the sort of trip a commuter or urban rider would do.
Record:
- the start odometer
- the finish odometer
- the recharge energy needed to return the battery to full
- your electricity unit price from your bill
For this example, avoid attaching fixed figures that may not match your own setup. The important thing is the process:
MetricMeasurement / CalculationResultDistance riddenEnd odometer minus start odometerYour route distanceElectricity used to rechargeMetered wall energyYour kWh readingConsumption in Wh/km(kWh used × 1000) ÷ km riddenYour Wh/kmConsumption in kWh/100km(kWh used ÷ km ridden) × 100Your kWh/100kmTrip costkWh used × your tariffYour trip costCost per mileTrip cost ÷ miles riddenYour cost per mile
Sample Cost-Per-Mile Calculation (Vmoto TC Max)
What this gives you is a proper ownership number. If your recharge takes more electricity than expected, your real-world cost rises. If your route is efficient and your riding is smooth, the cost drops.
That's why wall measurement matters so much. It reflects the energy you bought, not just the energy the bike may have used internally.
A rider who uses a TC Max mainly for town work might then compare:
- weekday commuting
- delivery shifts with frequent stopping
- colder-weather use
- weekend leisure rides at steadier pace
Those comparisons are often more useful than any single headline range figure.
Here's a useful visual walk-through of the bike in question before you run your own calculations:
If you're choosing between models, this same method works across road bikes, electric mopeds, and even off-road machines. The only thing that changes is the route and the type of riding you're trying to represent.
How to Interpret Your Efficiency Numbers
You charge overnight, ride the same commute all week, then see two very different efficiency readings. That usually points to changes in use, conditions, or charging losses, not bad maths.
Why wall power and bike power are not the same
Your wall figure is the one that matters for running cost because it reflects the electricity you paid for. The bike's battery capacity is still useful, but it does not include what is lost through charging, battery management, and the drivetrain before that energy reaches the road.
That gap matters.
If your calculation from the plug looks worse than a simple battery-capacity estimate, that can be completely normal. For UK riders, especially those charging in cold weather or topping up in short sessions, wall consumption often gives a more honest ownership number than any headline spec sheet.
Keep cost efficiency and vehicle efficiency separate. One tells you what each mile costs. The other helps explain how effectively the bike is using the energy it takes in.
What your number says about your riding
A repeatable figure is usually a good sign. It means your route, speed, load, and charging pattern are reasonably consistent. If the number swings about, look at the ride before you look for a fault.
Common causes are straightforward:
- Traffic conditions: More stops and restarts usually raise consumption.
- Throttle use: Fast launches use more energy than smooth pullaways.
- Load: Panniers, delivery boxes, tools, and a pillion all make the motor work harder.
- Terrain and surface: Hills, rough roads, and poor surfaces all push the figure up.
- Temperature and wind: Cold batteries and strong headwinds can move your numbers more than riders expect.
For fleet or business use, the calculation becomes particularly useful. Two identical electric mopeds can end up with different running costs because one does short urban runs with repeated stops and the other does steadier mixed-road mileage. Same bike. Different job.
A useful benchmark mindset
Use your numbers as a baseline, not a badge of honour.
Run the comparison as consistently as you can. Same charger, similar route, similar tyre pressure, similar load. That gives you a reference point you can trust. Then, if consumption rises, you can usually trace it back to weather, riding style, route choice, or extra weight instead of guessing.
Some riders keep this in a simple spreadsheet. Others log it in service notes along with tyre changes and maintenance dates. Flex Electric also covers practical specifications and running considerations for electric mopeds and motorcycles on its UK range, which can help when you are comparing models before you buy.
Simple Tips to Boost Your Bike's Efficiency
Once you know your baseline, saving energy becomes much easier because you can tell what works and what only sounds sensible.
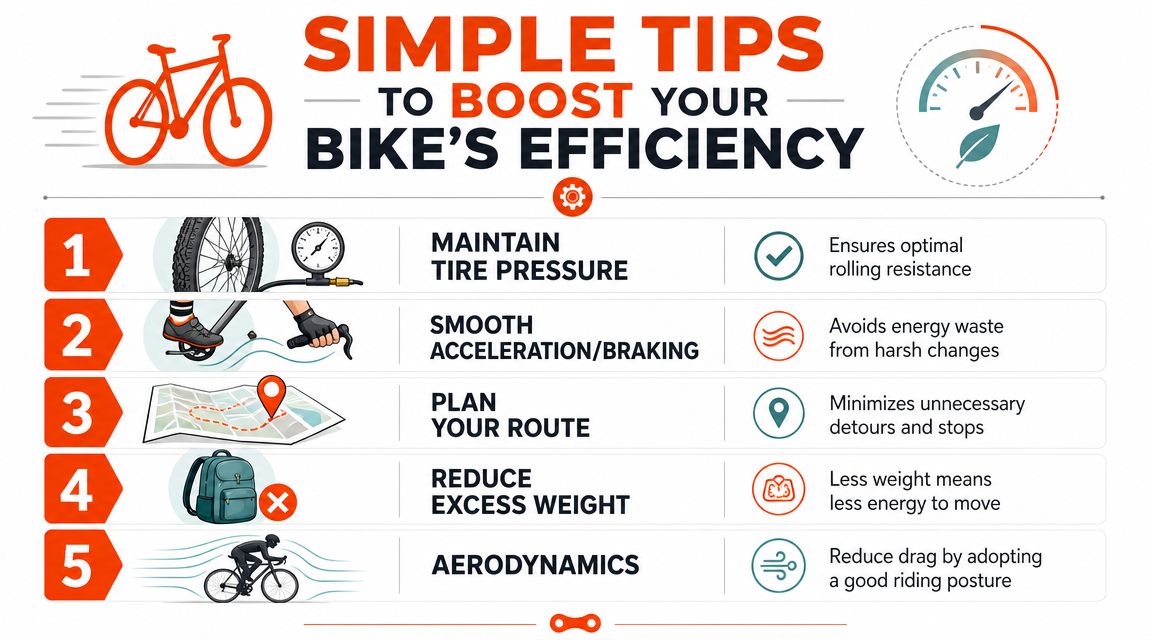
Riding habits that waste less energy
The biggest gains usually come from the rider, not the charger.
- Smooth acceleration: Electric torque is immediate, which is great to ride but easy to overuse. Hard launches consume more energy than often thought.
- Early roll-off: If your bike has regenerative braking, give it time to work. Late, abrupt braking throws away momentum.
- Steady urban pace: A consistent town speed often beats repeated bursts between lights.
- Route choice: A slightly longer route with fewer stops may use less energy than a shorter congested one.
Bike setup and load management
Small setup issues add up over weeks of riding.
- Tyre pressure matters: Underinflated tyres increase rolling resistance, which means the motor has to work harder.
- Chain and drivetrain care: On models that use chain drive, poor adjustment or neglected maintenance creates drag.
- Extra weight costs energy: Top boxes, cargo, tools, and bulky gear all affect efficiency.
- Rider position counts: At higher road speeds, wind resistance matters more than many urban riders think.
Good efficiency usually comes from boring habits done consistently. Smooth inputs, correct pressures, and sensible loads beat one-off tricks every time.
For kids motocross bikes and off-road electric motorcycles, the same principle applies with a different emphasis. Terrain, tyre choice, and aggressive riding style have a much larger effect than they do on a city commuter moped. Measure your own use in the conditions you ride.
If you want help choosing an electric moped, motorcycle, off-road bike, or kids MX model with running costs that fit the way you ride, Flex Electric can help you compare real-world options and work through the numbers before you buy.
Find us
You will find us at 74 Dalry Road, Edinburgh, EH11 2AY
Showroom Opening Times:
Monday: By Appointment
Tuesday to Friday: 11am - 5:00pm
Saturday: 10am - 5pm
Sunday: By Appointment
